Ethiopian Demography and Health
The 2007 census count in Dire Dawa resulted in a total population of 342827 with an even balance between the sexes - just over a thousand more men than women. The table below shows a five-year age distribution. The higher population in the 20-24 age group than the 15-19 group may have resulted from reporting errors but most likely it is the result of in-migration from the countryside or from other towns.
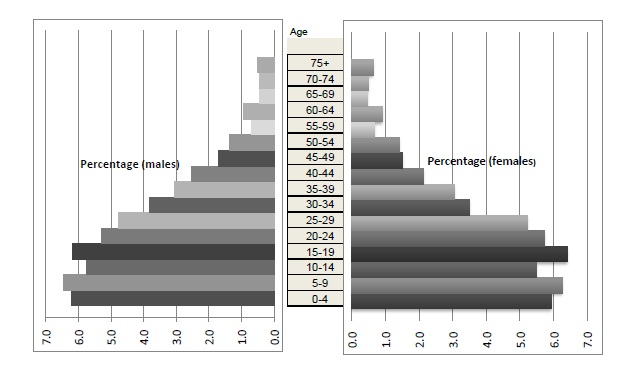
With 36 percent of the population below age 15 (see table and age pyramid below) the city has a young age structure although not as young as the surrounding counryside where fertility levels are higher.
Age Males Females %M %F
0 -- 4 21,306 20,322 6.2 5.9
5 -- 9 22,081 21,470 6.4 6.3
10 -- 14 19,700 18,808 5.7 5.5
15 -- 19 21,180 22,018 6.2 6.4
20 -- 24 18,130 19,674 5.3 5.7
25 -- 29 16,304 17,877 4.8 5.2
30 -- 34 13,092 12,007 3.8 3.5
35 -- 39 10,486 10,517 3.1 3.1
40 -- 44 8,633 7,266 2.5 2.1
45 -- 49 5,834 5,156 1.7 1.5
50 -- 54 4,682 4,880 1.4 1.4
55 -- 59 2,409 2,276 0.7 0.7
60 -- 64 3,193 3,104 0.9 0.9
65 -- 69 1,564 1,589 0.5 0.5
70 -- 74 1,546 1,721 0.5 0.5
75+ 1,790 2,212 0.5 0.6
Total 171,930 170,897 50.2 49.8
Total Both sexes 342,827
Source: Based on [1]
Dire Dawa Age Pyramid, 2007
References:
1.http://www.csa.gov.et